Chapter 1 Introduction
Package downloads are a proxy for the need for or the success of a package. As of December, 2020, total packages for R numbered 16,851 and 385 packages used the word “network” in the title. The latest monthly downloads yielded both total downloads and a clear leader in the area of network analysis: igraph. The two plots below show igraph downloads to other packages.
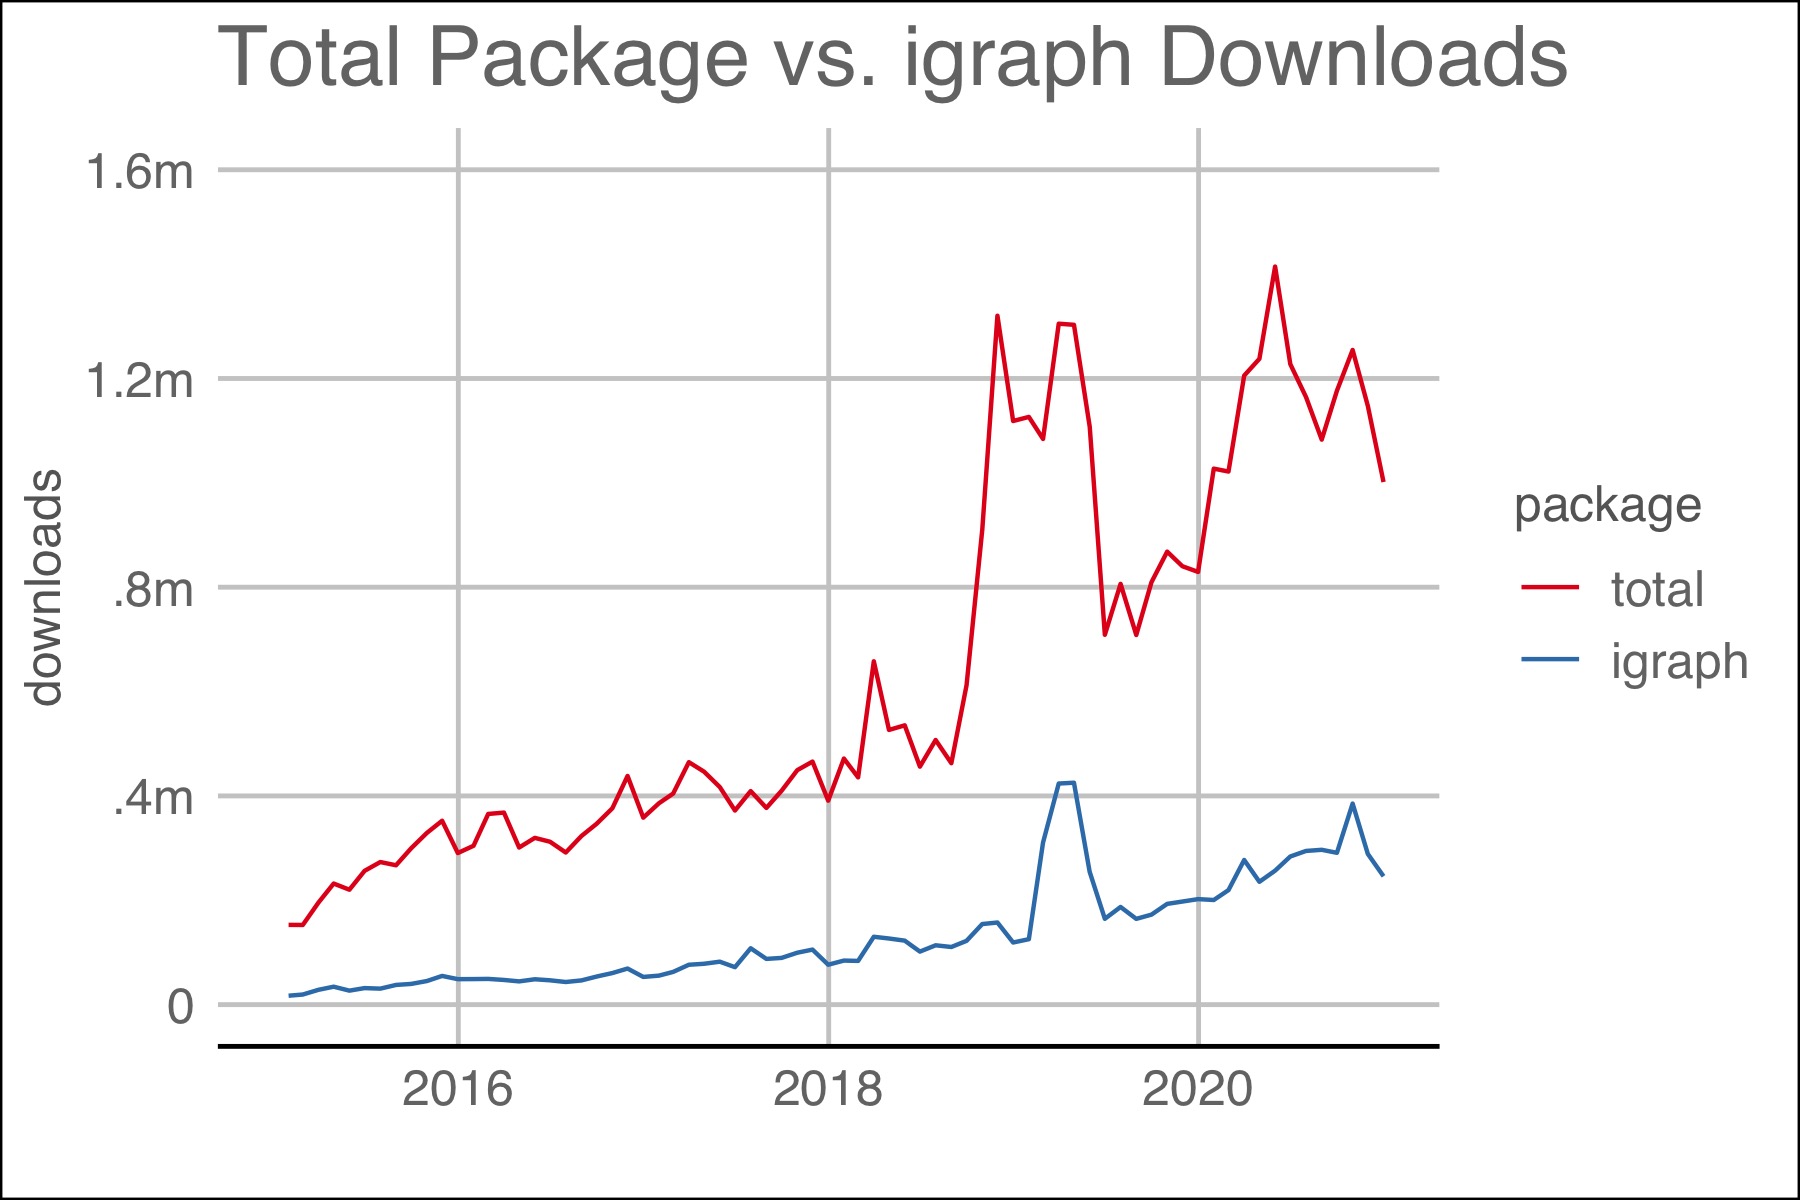
Figure 1.1: The plot above shows the number of downloads for all packages and igraph.
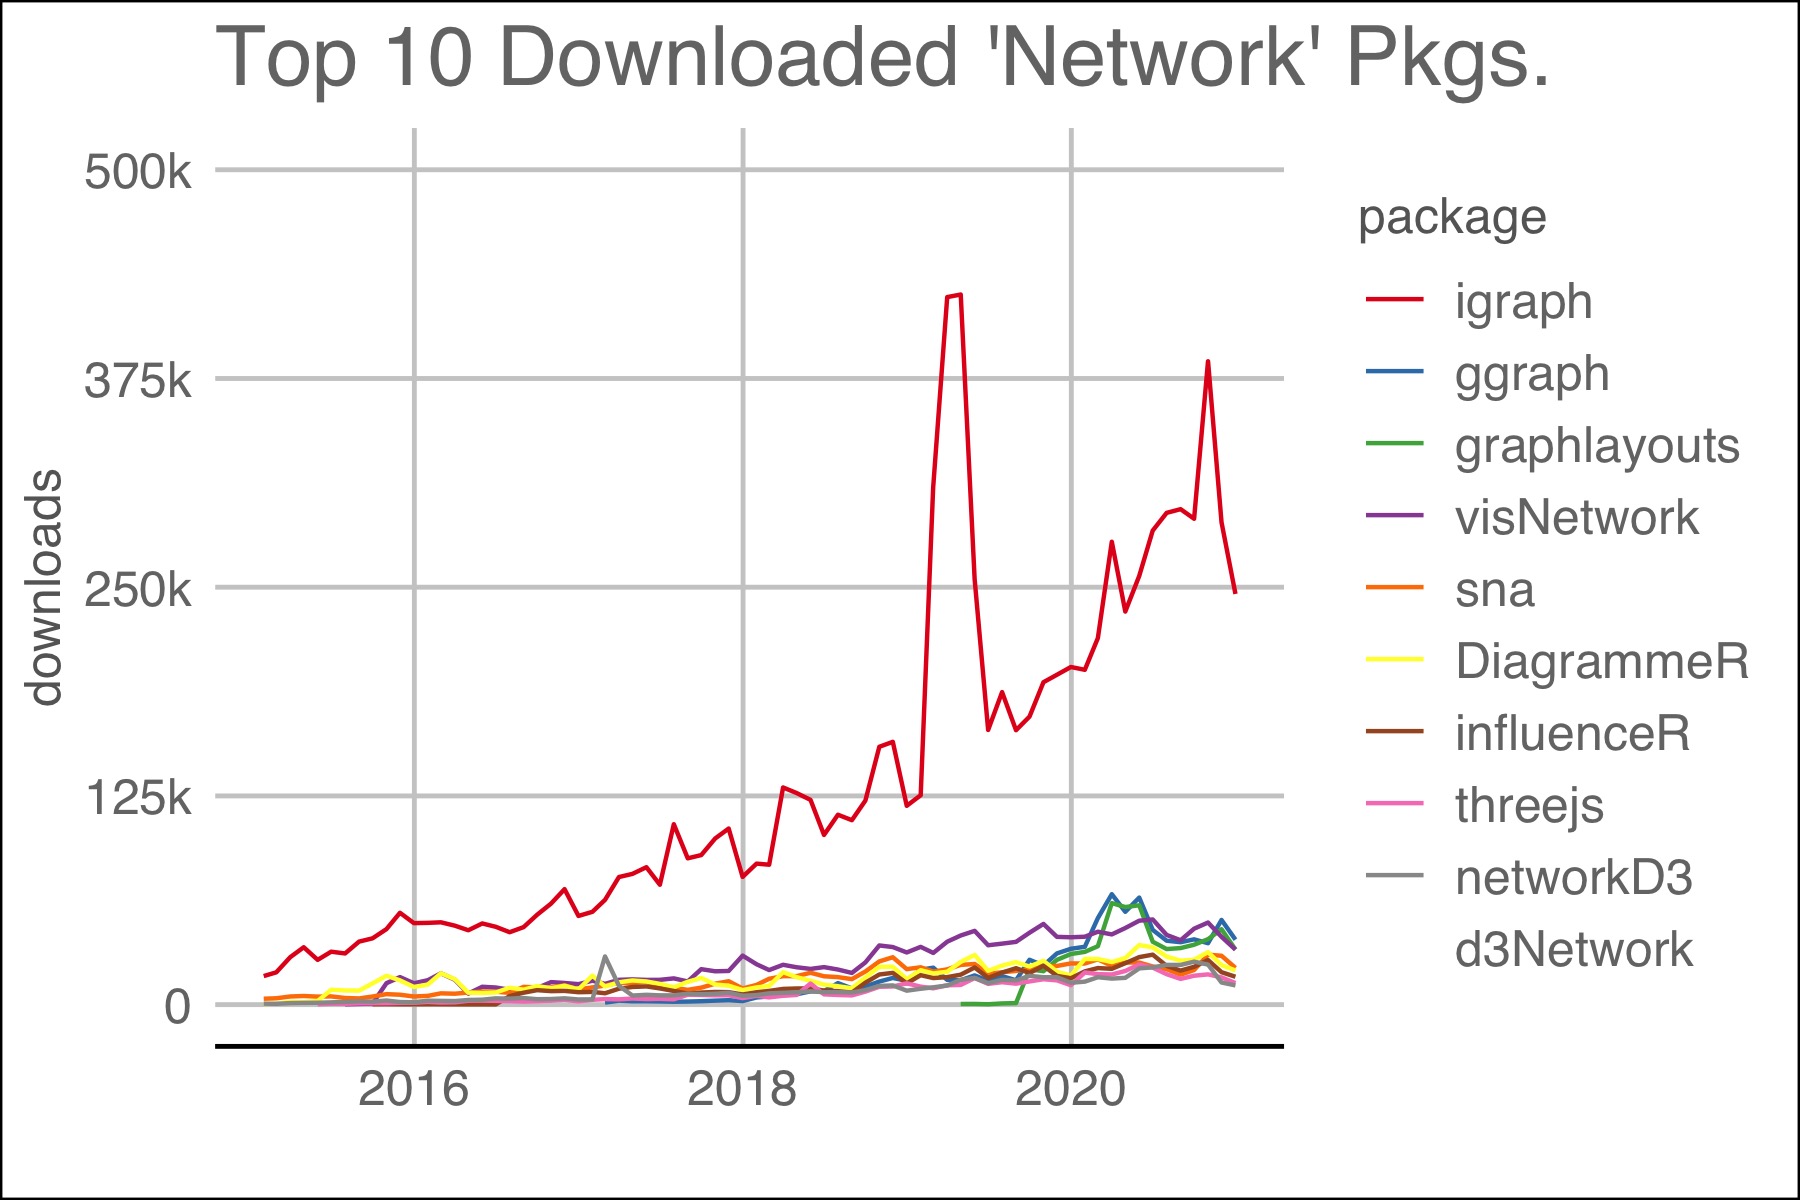
Figure 1.2: Top 10 packages with ‘network’ in their title. Packages dealing with computer networks like ‘RCurl’ were omitted.
1.1 Terms
“A network is not just a metaphor: it is a precise, mathematical construct of nodes (vertices, actors) N and edges (ties, relations) E that can be directed or undirected. We can include information (attributes) on the nodes as well as the edges.” (Jasney 2018)
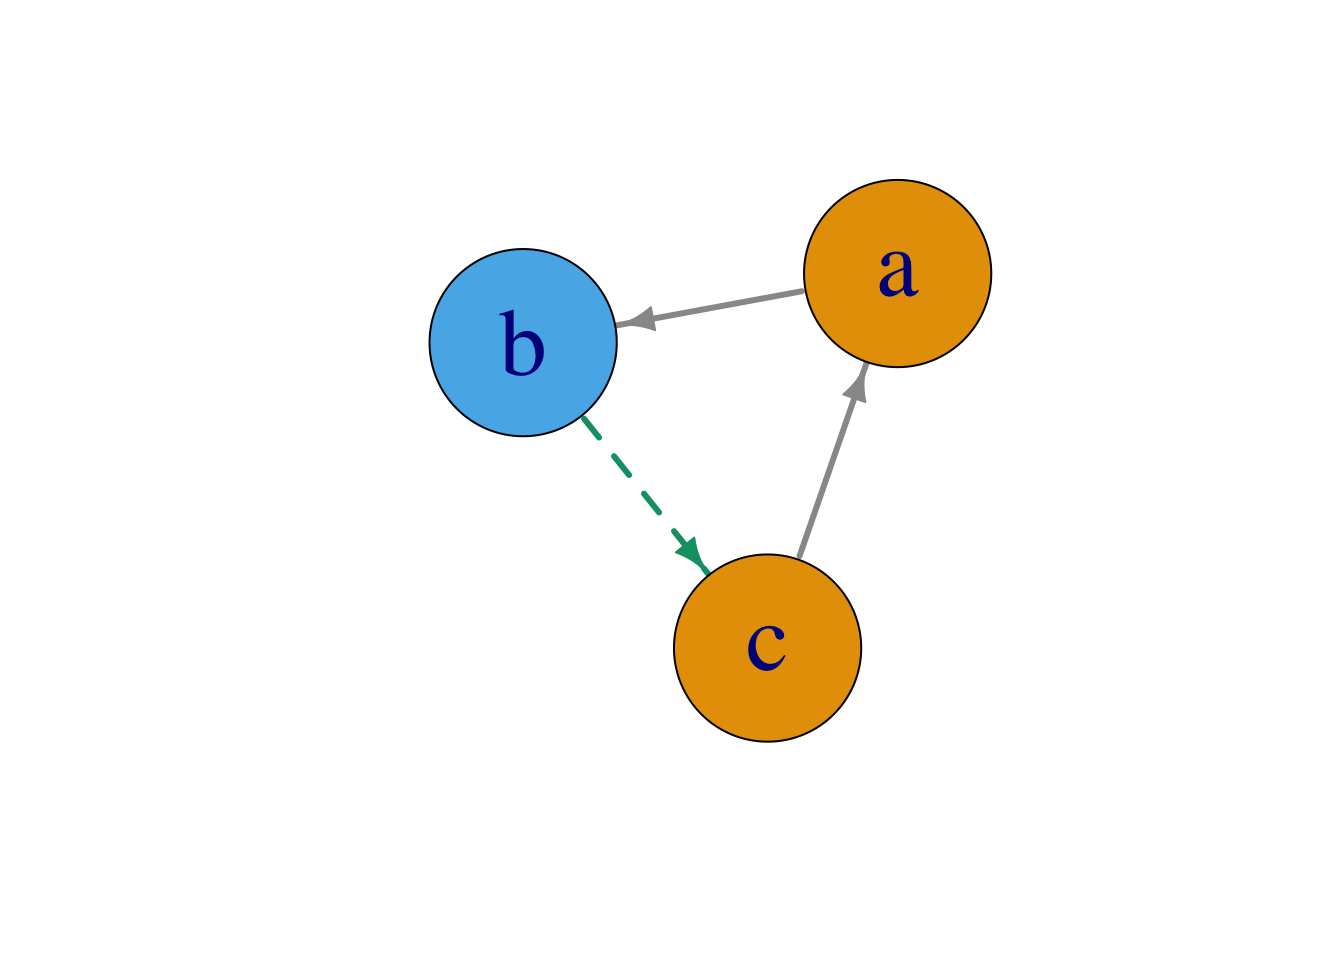
Figure 1.3: A network consisting of nodes, N, and directed edges E.
1.2 Understanding igraph Summary
The “karate” dataset is “a social network between members of a university karate club, led by president John A. and karate instructor Mr. Hi, which are pseudonyms. Sending the”karate" object to the console yields the output below:
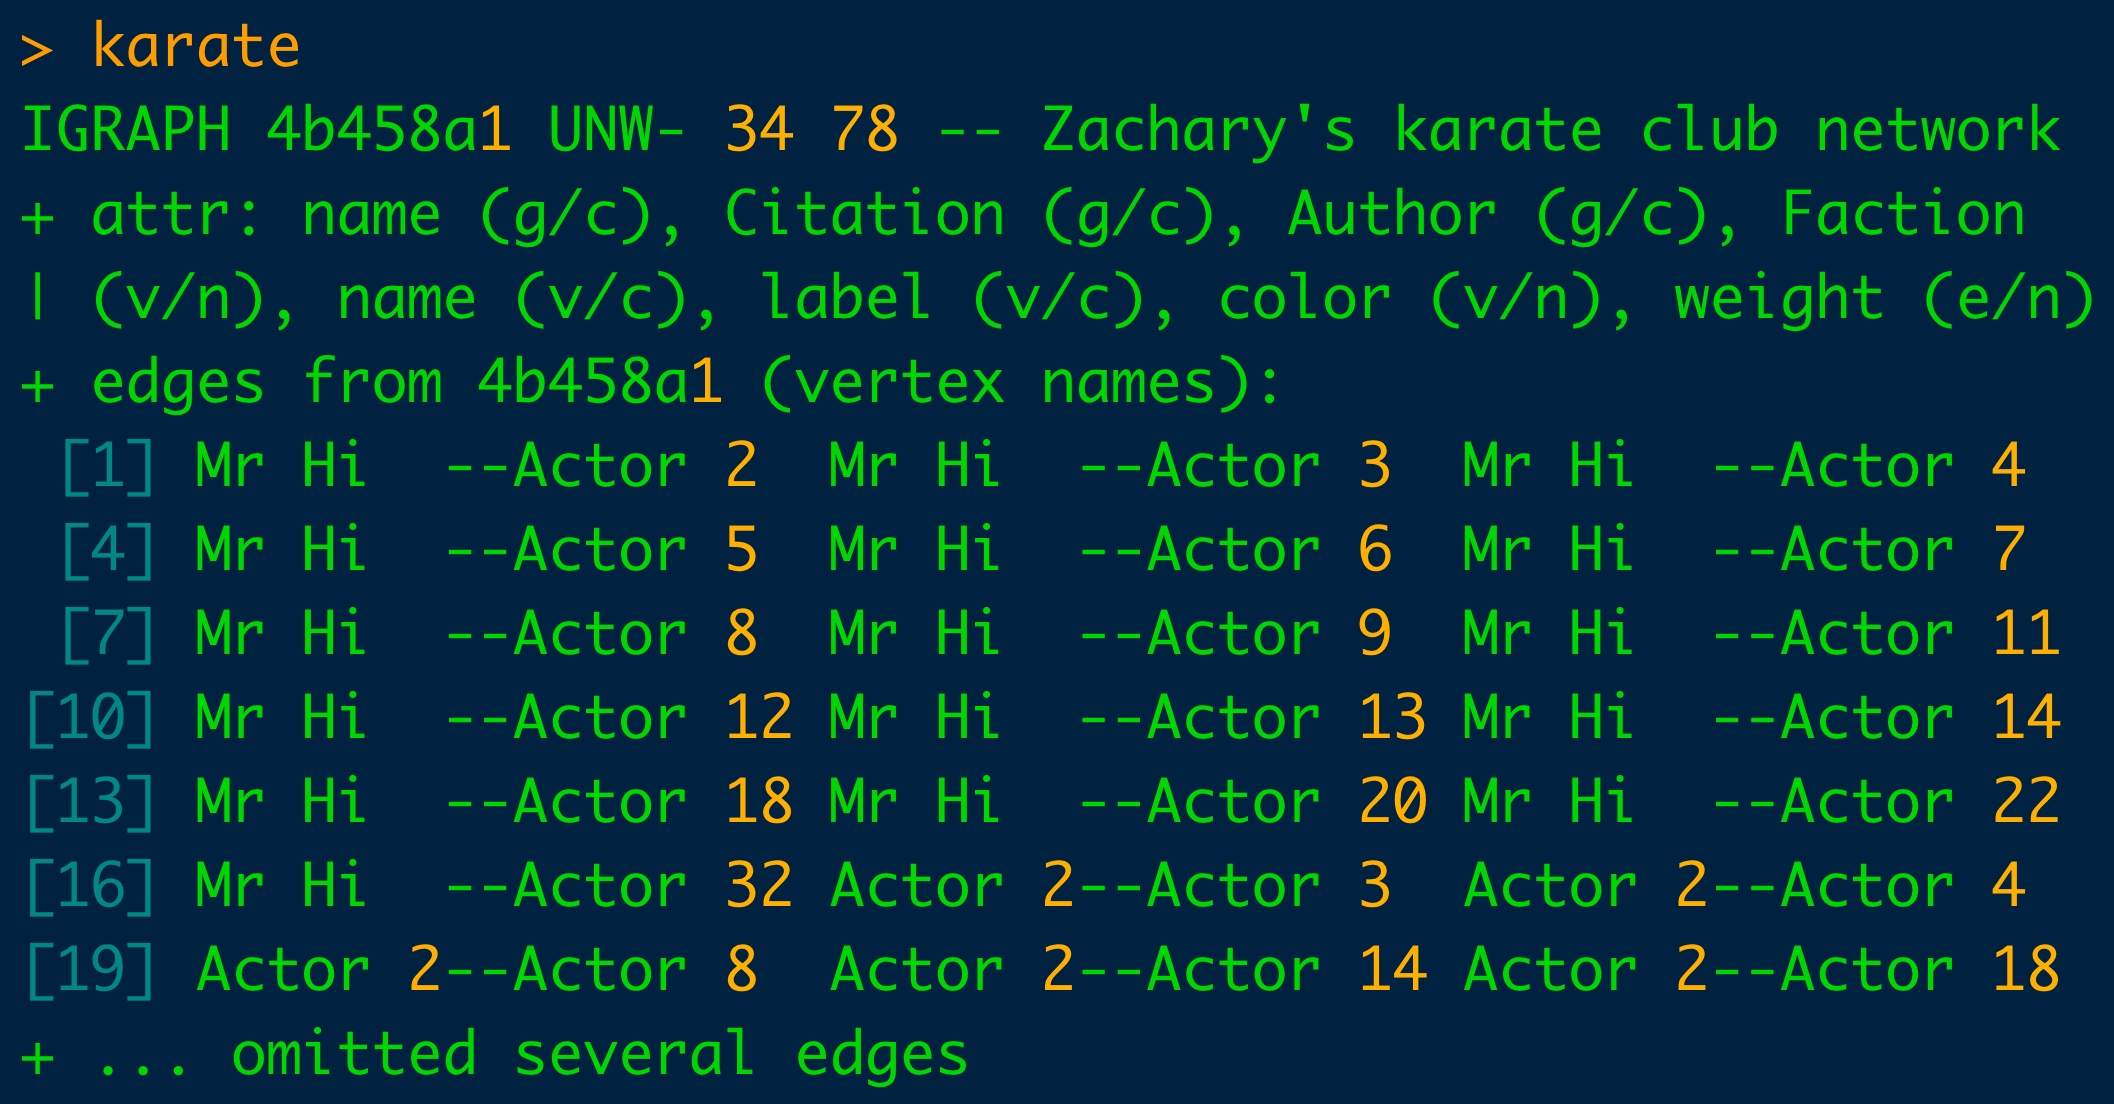
Understanding the console output above is critical to the comprehension of the graph object. Rote memorization will speed the use of igraph and graph production.
The first line identifies the object as an igraph graph and then there is 4 character letter-based code. The first character is assigned either a “D” or a “U” which indicates whether the graph is directed or undirected. The second letter is either an “N” or a dash (“-”) depending on whether the graph is “N”amed or not. The third letter is either a “W” or a dash depending on if it is weighted. And finally, the fourth character can be a “B” for bipartite or a dash.
The two numbers indicate the number of vertices and edges. Here, 34 nodes and 78 vertices comprise the “karate” club. Immediately adjacent to it is the name of the data set, “Zachary’s Karate Club”. And thereafter is the list of the node and vertex attributes. Lastly, the edges of the graph are listed.
The parenthetical following the “+attr” tag can take on one of three values: “g” for graph, “v” for vertices and “e” for edge. The character following the forward slash within the parentheses can take on one of three values too and refers to data types within R: “n” for numeric, “c” for character, “l” for logical.
The actual data can be seen by querying with E(graphObject) and V(graphObject).
## + 5/78 edges from 4b458a1 (vertex names):
## [1] Mr Hi--Actor 2 Mr Hi--Actor 3 Mr Hi--Actor 4 Mr Hi--Actor 5 Mr Hi--Actor 6
and
## + 5/34 vertices, named, from 4b458a1:
## [1] Mr Hi   Actor 2 Actor 3 Actor 4 Actor 5
1.3 Creating Graphs
There are many ways to create a graph using igraph. In his book on igraph, author Csardi grouped a graph’s creation into (1) predefined structures, i.e. make_star(), (2) conversion of graph structures, ie. graph_from_literal(), (3) sample random graph models, i.e. sample_gnp() and (4) read_graph(). The code below lists possible ways to create a graph. In illustrating igraph functions, many of the graphs creation methods wil be used in subsequent chapters.
1.4 Manipulating Graphs
## IGRAPH 5525596 U--- 4 5 -- Diamond
## + attr: name (g/c)
## + edges from 5525596:
## [1] 1--2 1--3 2--3 2--4 3--4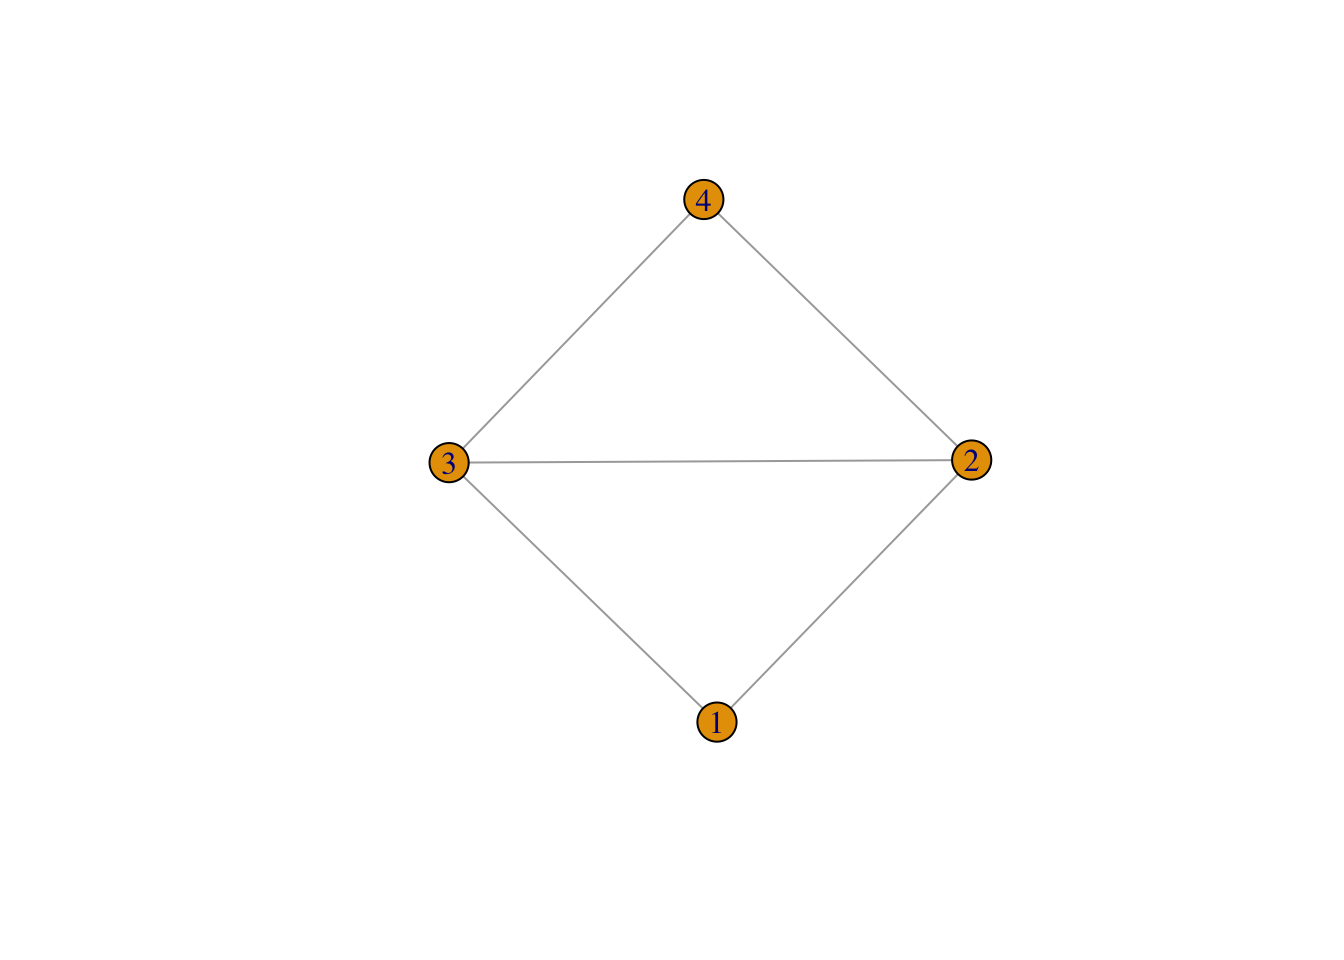
## 4 x 4 sparse Matrix of class "dgCMatrix"
##
## [1,] . 1 1 .
## [2,] 1 . 1 1
## [3,] 1 1 . 1
## [4,] . 1 1 .## [1] "Diamond"## + 4/4 vertices, from 5525596:
## [1] 1 2 3 4## + 5/5 edges from 5525596:
## [1] 1--2 1--3 2--3 2--4 3--4V(diamond)$name <- LETTERS[1: vcount(diamond)]
E(diamond)$weight <- 1:ecount(diamond)
plot(diamond,
edge.width = E(diamond)$weight)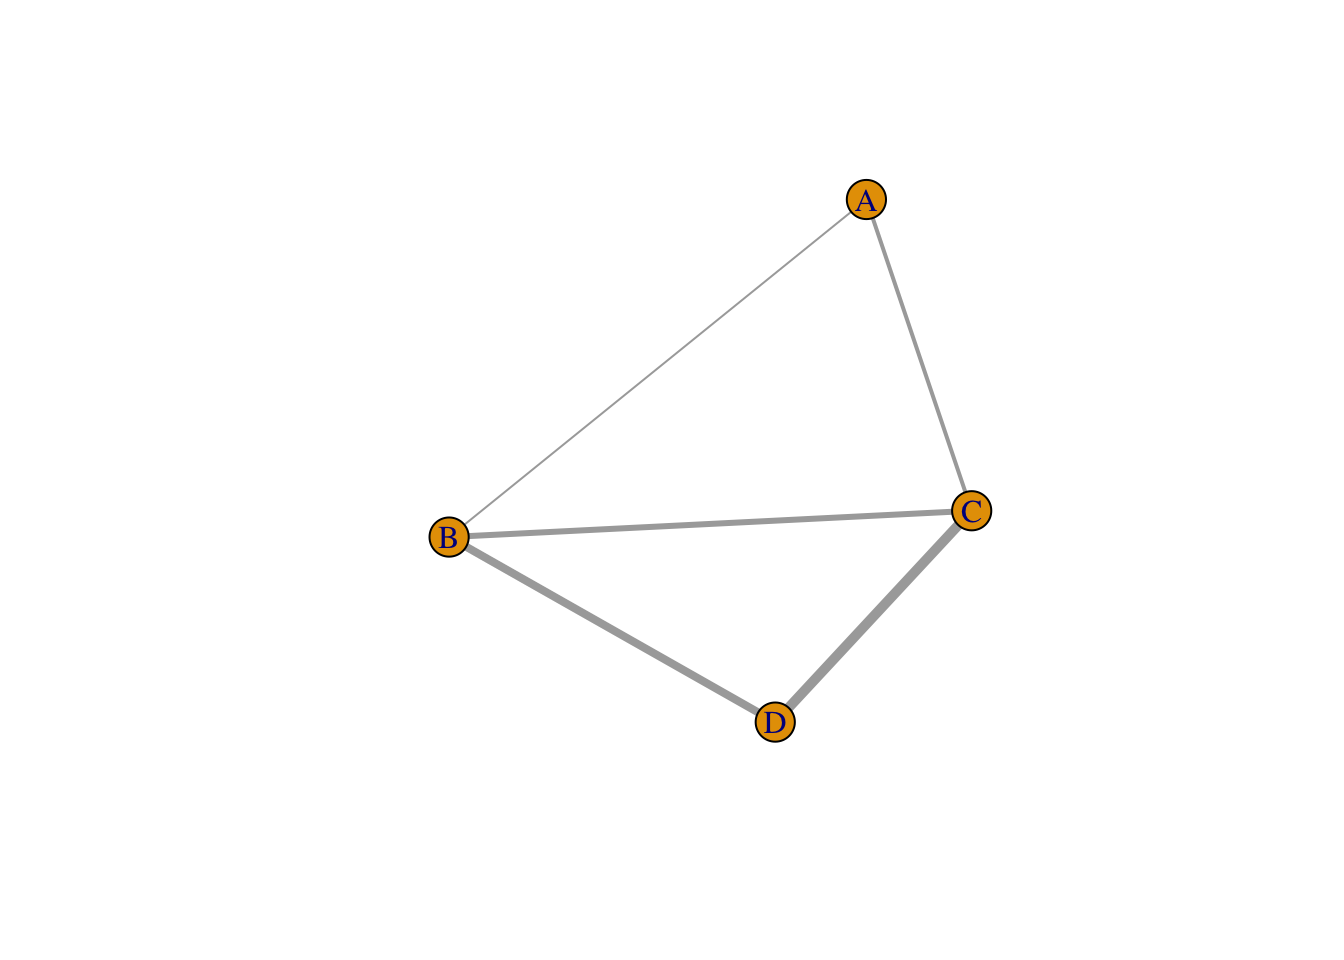
## IGRAPH 5525596 UNW- 4 5 -- Diamond
## + attr: name (g/c), name (v/c), weight (e/n)
## + edges from 5525596 (vertex names):
## [1] A--B A--C B--C B--D C--D## IGRAPH f4c3284 U--B 10 5 --
## + attr: type (v/l)
## + edges from f4c3284:
## [1] 1-- 2 3-- 4 5-- 6 7-- 8 9--10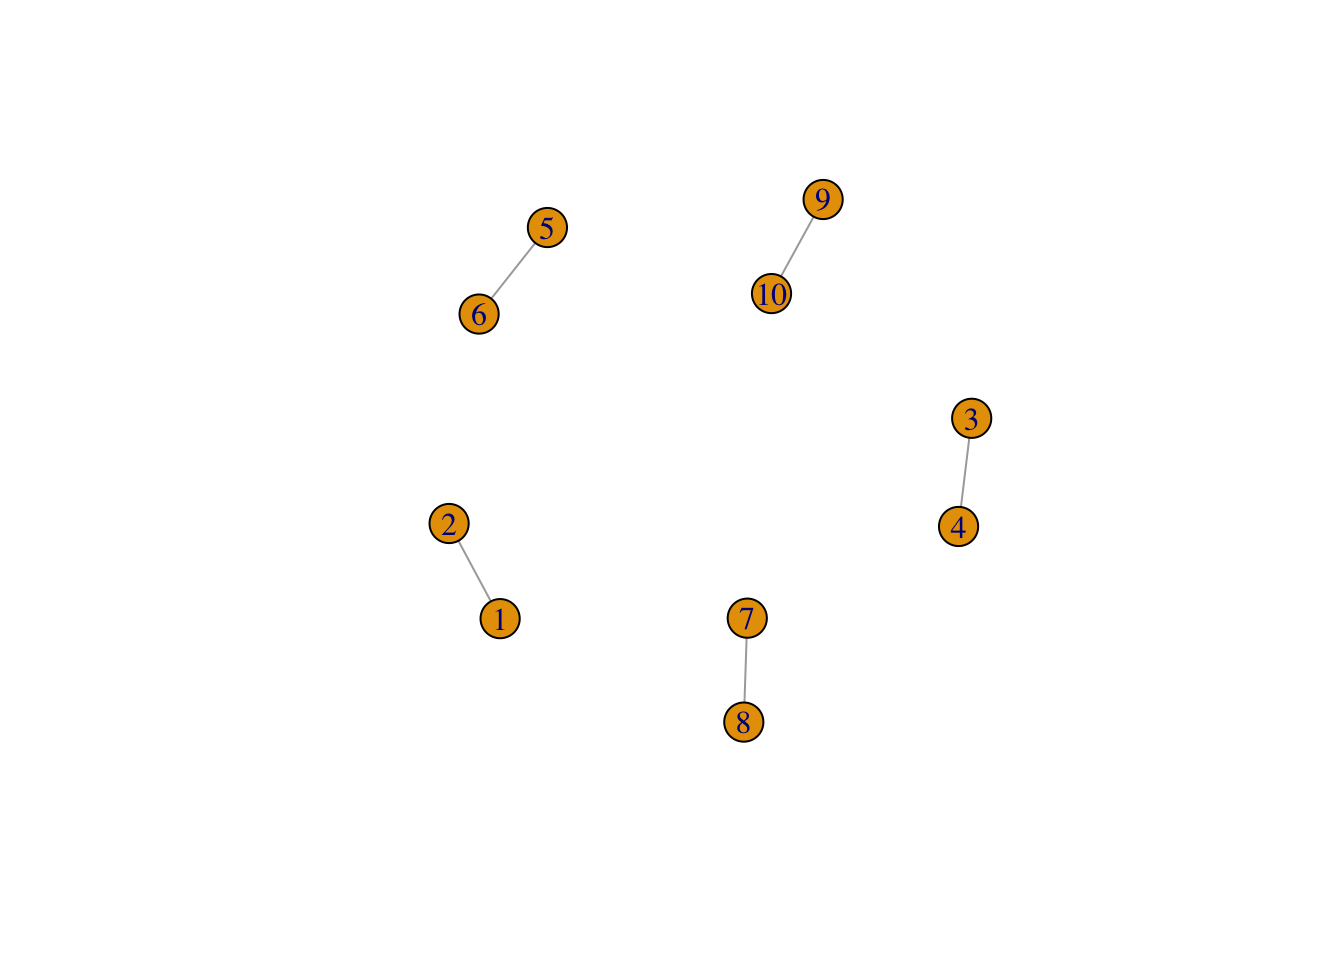
## + 10/10 vertices, from f4c3284:
## [1] 1 2 3 4 5 6 7 8 9 10## + 5/5 edges from f4c3284:
## [1] 1-- 2 3-- 4 5-- 6 7-- 8 9--101.5 Input formats
Building a network graph is challenging because of the number of potential input types. Users must first distinguish whether the input is an adjacency matrix, incidence matrix, or edge list. Then, the user must know if the graph is directed or undirected, weighted or unweighted. (Holtz 2020)
1.5.1 Adjacency matrix
An adjacency matrix is a square matrix where the number of rows and columns are the same. igraph can read an adjacency matrix using the graph_from_adjacency_matrix() function.
| A | B | C | D | E | F | |
|---|---|---|---|---|---|---|
| A | 0 | 1 | 0 | 0 | 0 | 0 |
| B | 0 | 0 | 0 | 0 | 0 | 0 |
| C | 0 | 0 | 0 | 1 | 0 | 0 |
| D | 1 | 0 | 0 | 0 | 0 | 0 |
| E | 0 | 0 | 0 | 0 | 2 | 2 |
| F | 2 | 0 | 1 | 0 | 0 | 0 |
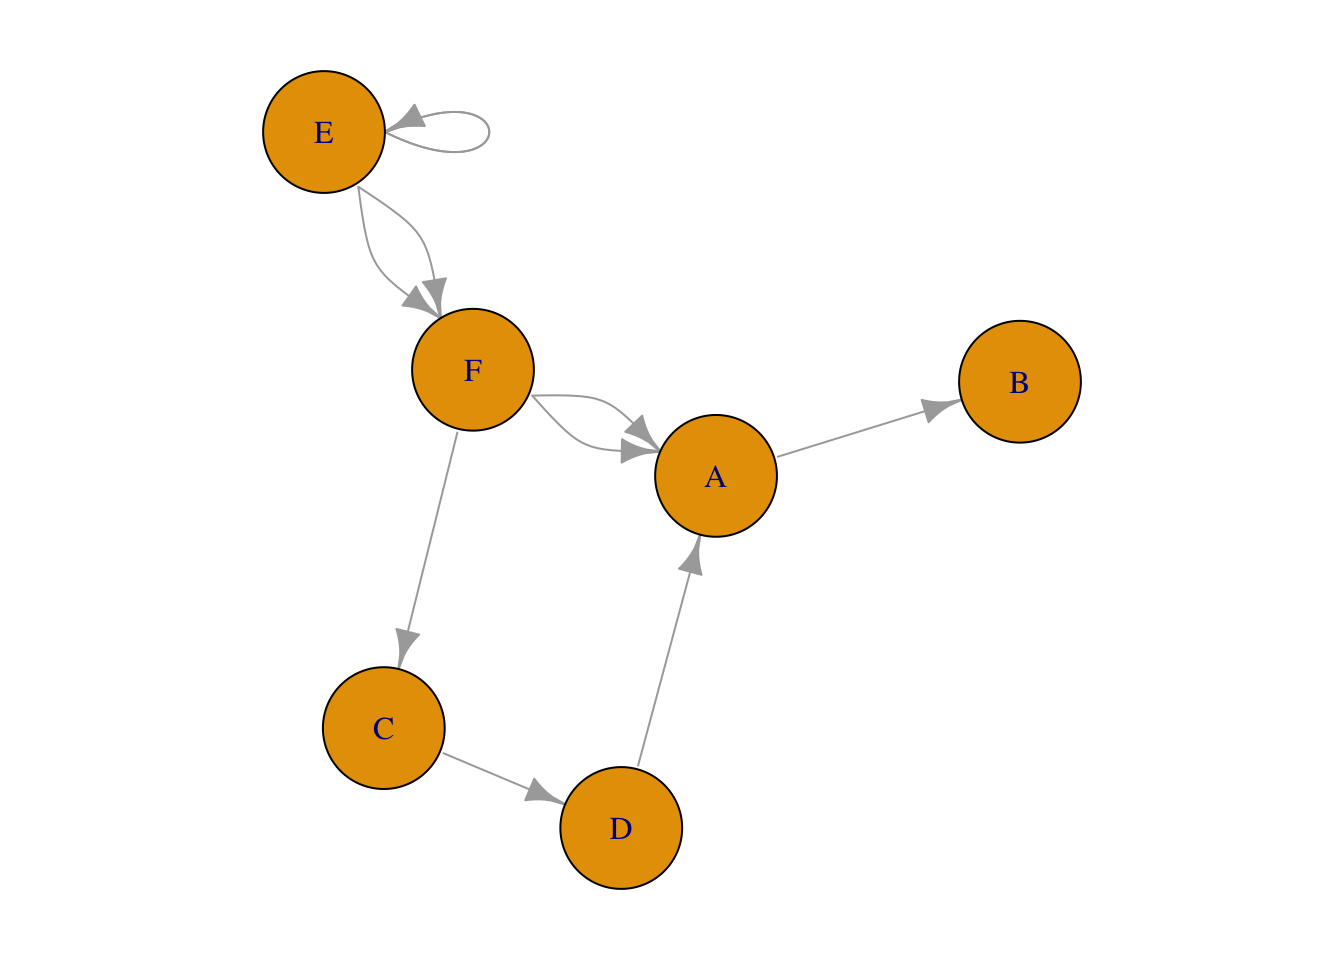
Figure 1.4: Network plot from adjacency matrix
1.5.2 Sparse matrix
The function, graph_from_adjacency_matrix(), also accepts a sparse matrix which is sometimes preferred to minimize file sizes and conserve system resources on large datasets.
## 5 x 5 sparse Matrix of class "dgCMatrix"
##
## [1,] . . 1 1 1
## [2,] 1 1 1 . .
## [3,] 1 . . . 1
## [4,] 1 1 1 . .
## [5,] 1 . 1 . 1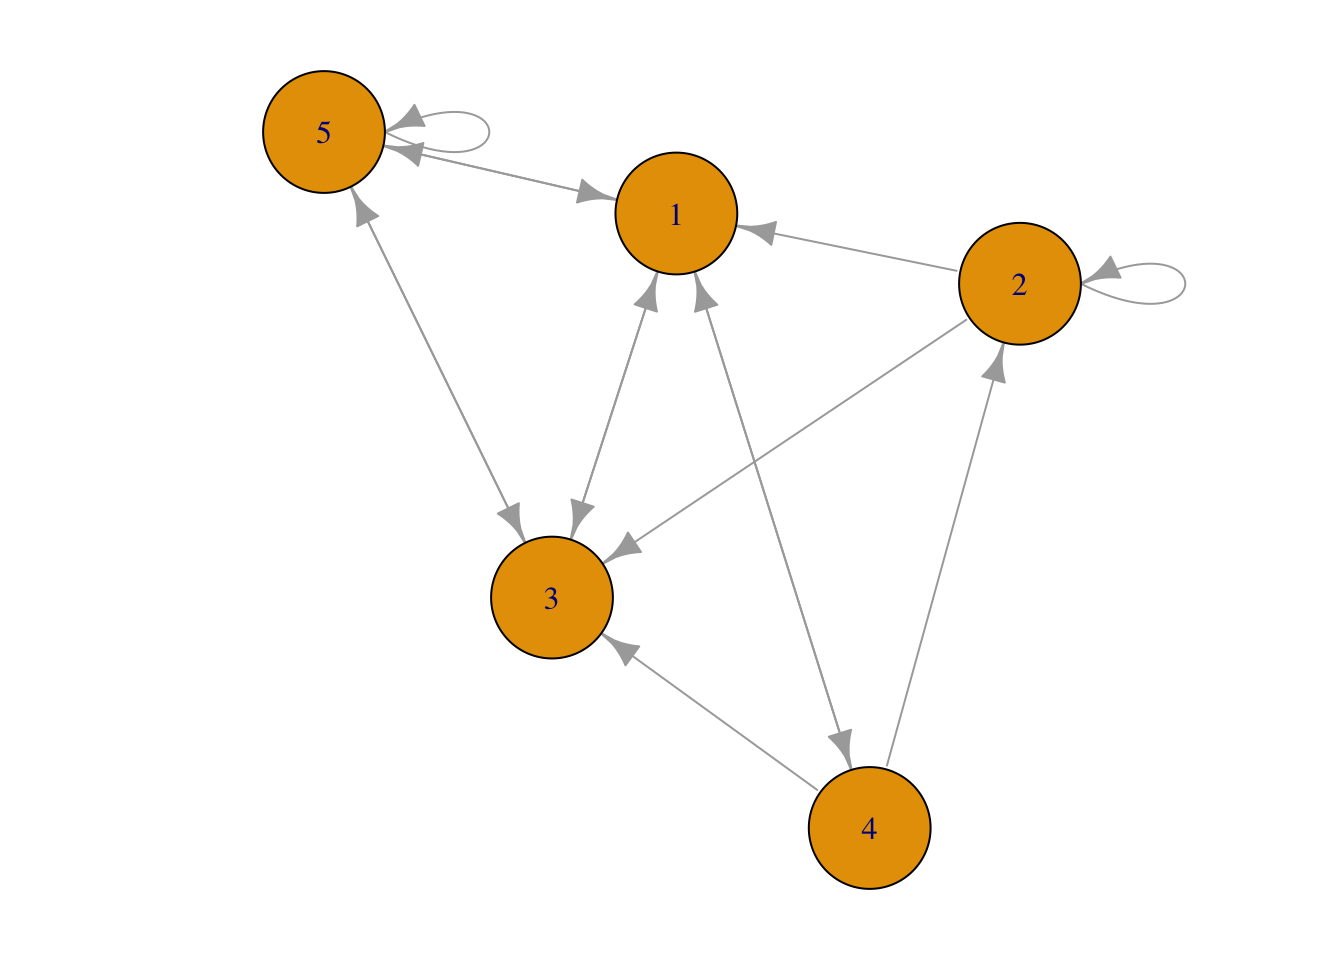
Figure 1.5: Network plot from sparse matrix.
1.5.3 Incidence matrix
The rows and columns of an incidence matrix do not have to be equal. Its shape can be rectangular in addition to square. igraph can read an incidence matrix using the graph_from_incidence_matrix().
| a | b | c | d | e | |
|---|---|---|---|---|---|
| A | 0 | 2 | 0 | 2 | 0 |
| B | 2 | 1 | 0 | 0 | 1 |
| C | 0 | 1 | 1 | 2 | 0 |
| D | 1 | 2 | 1 | 0 | 0 |
| E | 0 | 2 | 1 | 0 | 1 |
| F | 2 | 0 | 1 | 0 | 1 |
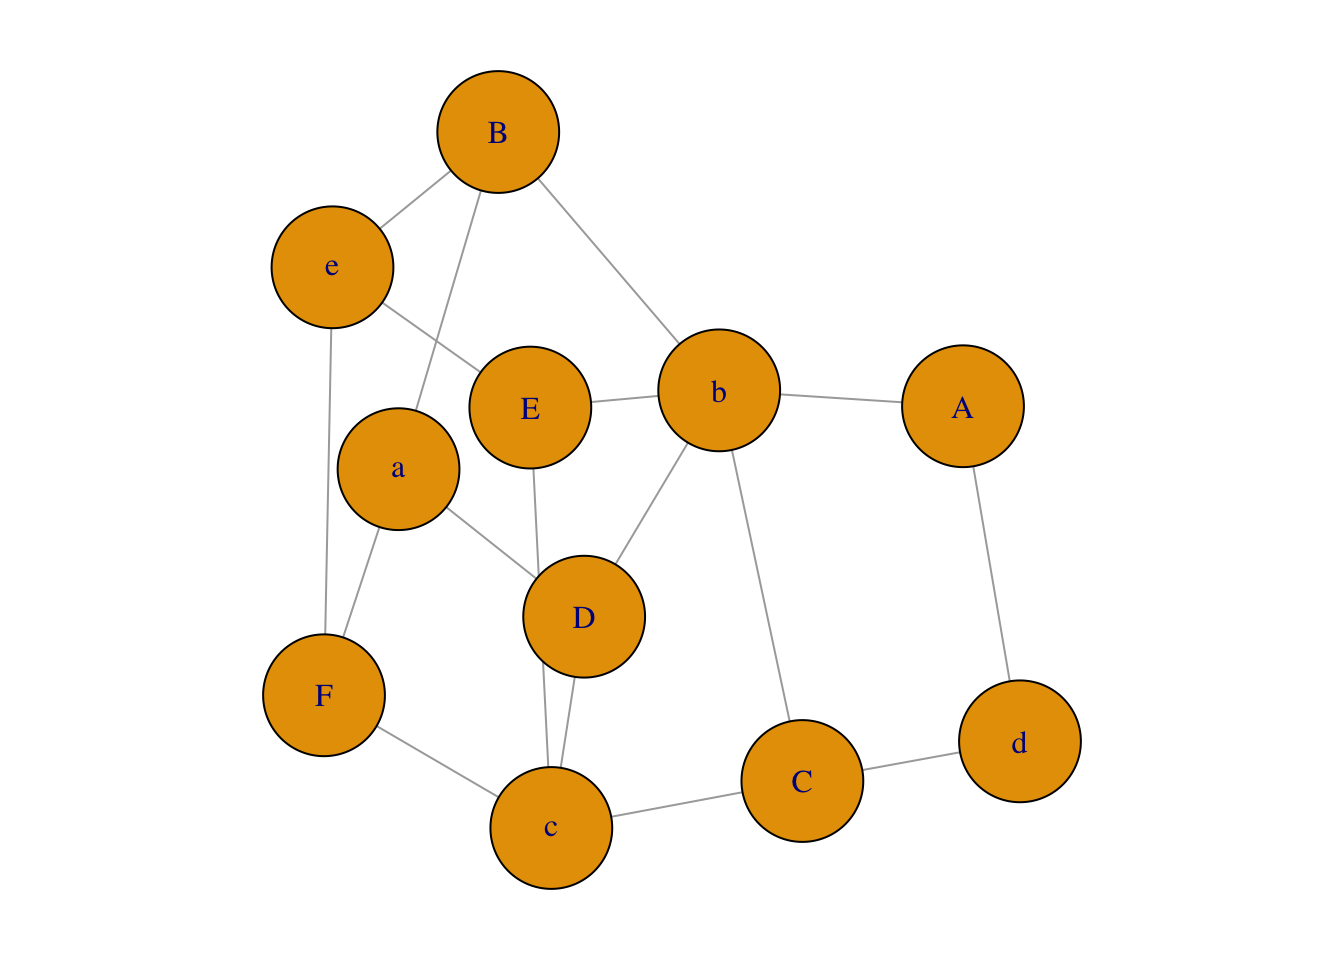
Figure 1.6: Network plot from incidency matrix.
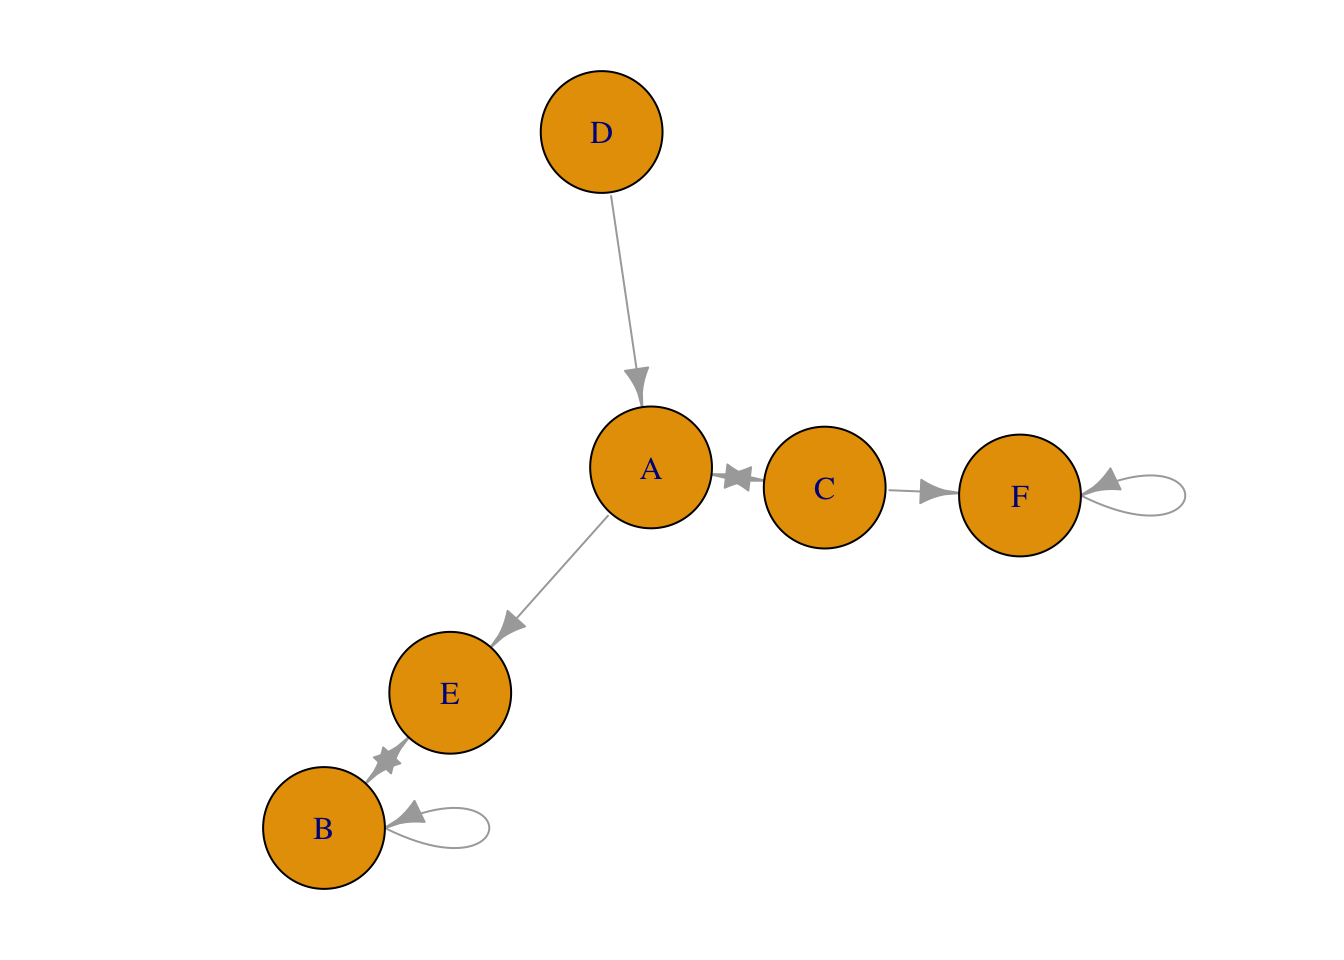
1.5.4 Edge list
An edge list has 2 columns. Each observation represents a connection between two things. The two column names are alternatively named (1) an origin and a destination or (2) a source and target, depending on the package used. The correct column names are often the key to a successful importation of the data in many applications. igraph imports an edge list graph_from_edgelist() function.
| origin | destination |
|---|---|
| A | C |
| D | A |
| A | E |
| B | E |
| E | B |
| C | F |
| F | F |
| B | B |
| C | A |
Figure 1.7: Plot generated from edgelist.
1.5.5 Dataframe distinguished
“A data frame may for many purposes be regarded as a matrix with columns possibly of differing modes and attributes.” (R Core Team 2020) In other words, a matrix must contain all of the same data type while a dataframe can have columns with differing data types – numeric, character, factor, etc. Different authors and packages require one or the other and many coerce to the required data type internally without notification to the user. Matrices may offer greater computational efficiency although it may depend on the data types included. (find cite)
1.6 Datasets
igraphdata contains a number of datasets that illustrate the use of network analysis. The command data(package="igraphdata") lists the datasets available. After loading the package, data("karate") will load, for example, the “karate” dataset.
| Item | Title |
|---|---|
| Koenigsberg | Bridges of Koenigsberg from Euler’s times |
| UKfaculty | Friendship network of a UK university faculty |
| USairports | US airport network, 2010 December |
| enron | Enron Email Network |
| foodwebs | A collection of food webs |
| immuno | Immunoglobulin interaction network |
| karate | Zachary’s karate club network |
| kite | Krackhardt’s kite |
| macaque | Visuotactile brain areas and connections |
| rfid | Hospital encounter network data |
| yeast | Yeast protein interaction network |
1.7 Sanity Checks
A “sanity check” in coding is a method to determine if an error is the result of the code or the data used. It’s probably a safe presumption that a dataset resident within a package is formatted correctly. However, it may be helpful to check user-built data structures in a program like Gephi or Cytoscope. Both Gephi and Cytoscope require some familiarity before use.
References
Holtz, Yan. 2020. “Network Graph | the D3 Graph Gallery.” https://www.r-graph-gallery.com/network.html.
Jasney, Lorien. 2018. “Introduction to Social Network Analysis in R.” Utrecht University.
R Core Team. 2020. “An Introduction to R.” https://cran.r-project.org/doc/manuals/r-devel/R-intro.html#Data-frames.