Chapter 10 Case Study – Blue Riband
10.1 Introduction
The “Blue Riband” was a recognition given to the passenger ship that maintained the highest average speed across the northern Atlantic Ocean. The prize was not regularly awarded but rather as a ship bested a previous record. Some years contained more than one blue riband winner while others had none.
| flag | wins |
|---|---|
| GBR | 87 |
| DEU | 17 |
| USA | 7 |
| FRA | 5 |
| ITA | 1 |
The west-bound trip typically originated from Western Europe and ended in New York harbor which is reported as “Sandy Hook”, “Ambrose Lightship”, “Ambrose” or just plain “New York”. It was considered the more difficult journey as the Gulf Stream water currents slowed ship speeds. Ships that won the riband on the western route typically won it on the eastern trip as well.
For perspective, trips across the Atlantic in the late 1700s and early 1800s lasted several weeks with one traveler reporting a trip of 57 days. The advent of the steamship and its inclusion into ships resulted in faster times and more consistency in trip duration.
Like more contemporary national contests–space and aeronatics, the winning of the blue riband was a source of national pride and a public demonstration of a nation’s technology prowess. The contests lasted from 1854 to 1952 and the ships crossed the Atlantic in ever faster times and speeds.
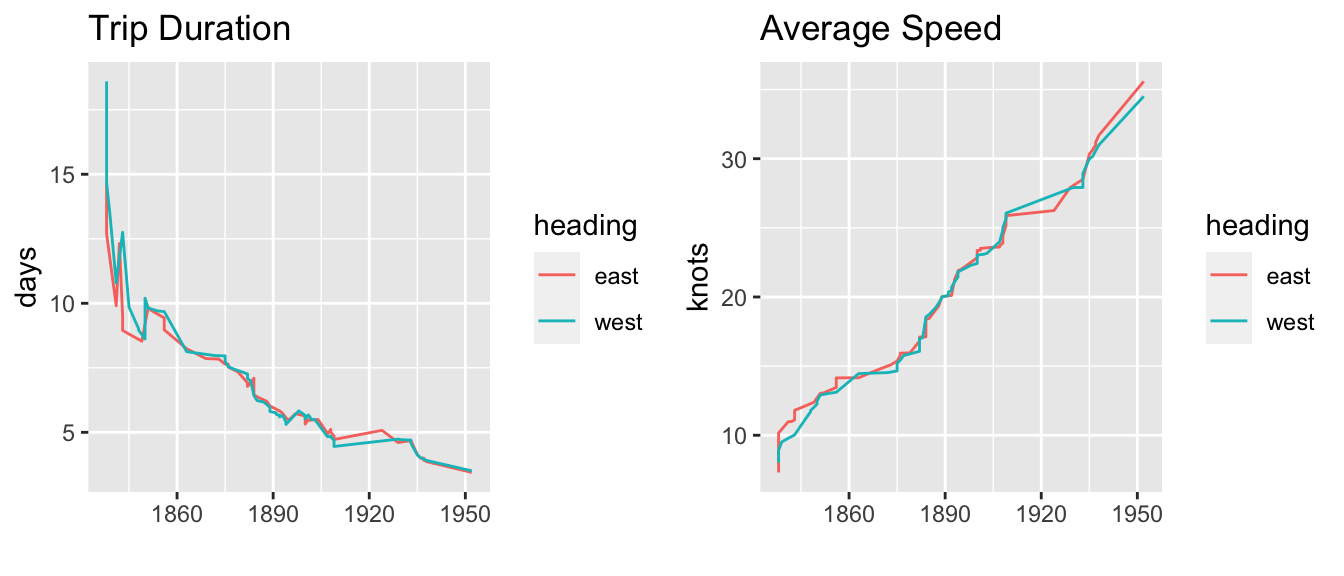
Figure 10.1: Graphs showing decline in trip duration and the increase in speed. Note the small difference in east and west bound trips after 1860.
The purpose of this case study is to layer a network over a map. For specifics, the script can be found under the ./R directory. The dataset was scraped from a Wikipedia article and geotagged using google maps. There are 119 observations which divide almost equally between eastbound and westbound winners.
10.2 Igraph
#import files
file <- "./data/rkw/blue_ribald_nodes.csv"
nodes <- tibble(data.table::fread(file = file))
file <- "./data/rkw/blue_ribald_edges.csv"
edges <- tibble(data.table::fread(file = file))
#create network for graph
g <- igraph::graph_from_data_frame(d = edges,
                                   directed = T,
                                   vertices = nodes
)
10.2.1 Layout with Kamada-Kawai
#plot igraph kk
par(mar = c(1, 1, 1, 1))
igraph::plot.igraph(g,
                    axes = F,
                    layout= layout_with_kk,
                    edge.arrow.size = .2,
                    edge.width = E(g)$weight,
                    vertex.size = 5,
                    vertex.shape = "circle",
                    vertex.frame.color = "white",
                    vertex.color = "skyblue",
                    vertex.label.cex = .75,
                    vertex.label.dist = -1.3,
                    margin = c(0, 0, 0, 0),
                    asp = 0,
                    main = "Blue Riband Ports"
                    )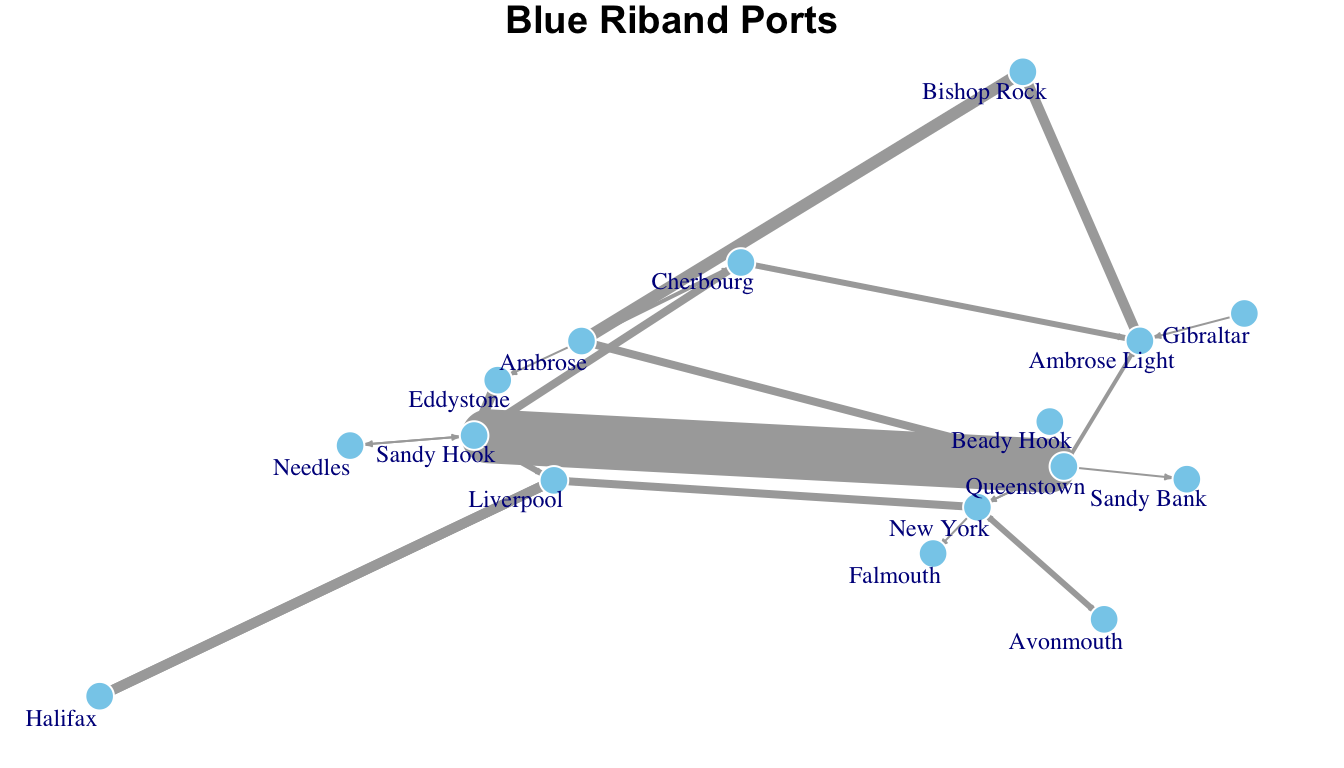
Figure 10.2: Note that the inter-nodal distace is maximized where the nodes have the most connections. Here, it is between Sandy Hook (New York harbor) and Queenstown.
10.2.2 Layout with Fruchterman-Reingold
This plot is from the same code as above but with layout set to layout = layout_with_fr.
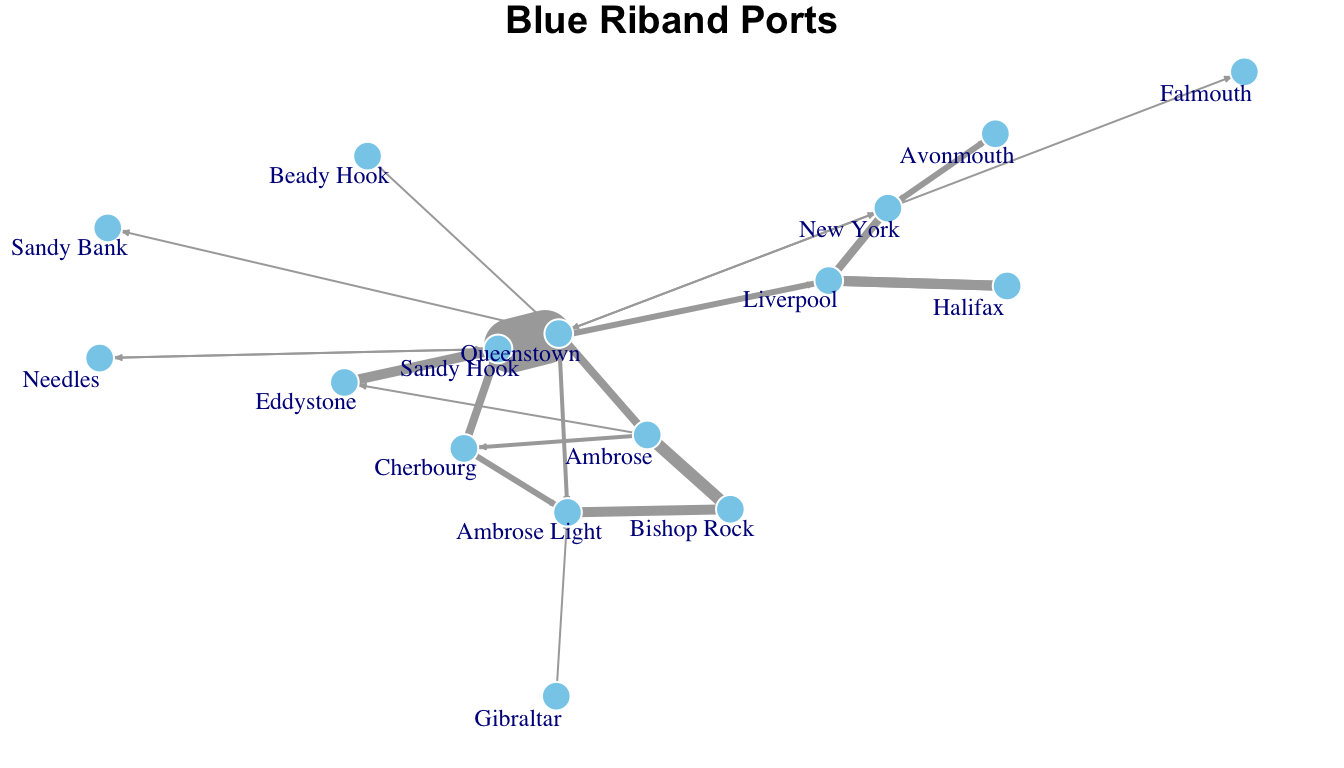
Figure 10.3: Note that the inter-nodal distace is minimized where the nodes have the most connections. Here, the shortest path is between Sandy Hook (New York harbor) and Queenstown.
10.3 Geosphere
While the above plots are helpful in understanding the frequency of connections between the different ports, they lack the insight that a map could bring to the discussion. The next plot utilizes the geosphere package and is taken from a tutorial by Dr. Nathan Yau at www.flowingdata.com.
library(maps)
library(geosphere)
pal <- colorRampPalette(c("#333333", "white", "#1292db"))
colors <- pal(100)

#map("world")
xlim <- c(-80, 10)
ylim <- c(30, 60)
map("world",
    col="#191919",
    fill=TRUE,
    bg="#000000",
    lwd=0.05,
    mar = c(0, 0, 0, 0),
    xlim=xlim,
    ylim=ylim
    )
edges <- dplyr::arrange(edges, weight)
maxcnt <- max(edges$weight)

for (i in 1:nrow(edges)) {
        port1 <- nodes[nodes$id == edges[i,]$from,]
        port2 <- nodes[nodes$id == edges[i,]$to,]
        inter <- gcIntermediate(c(port1[1,]$lon, port1[1,]$lat), c(port2[1,]$lon, port2[1,]$lat), n=100, addStartEnd=TRUE)
        colindex <- round( (edges[i,]$weight / maxcnt) * length(colors) )
        lines(inter, col=colors[colindex], lwd=2)
}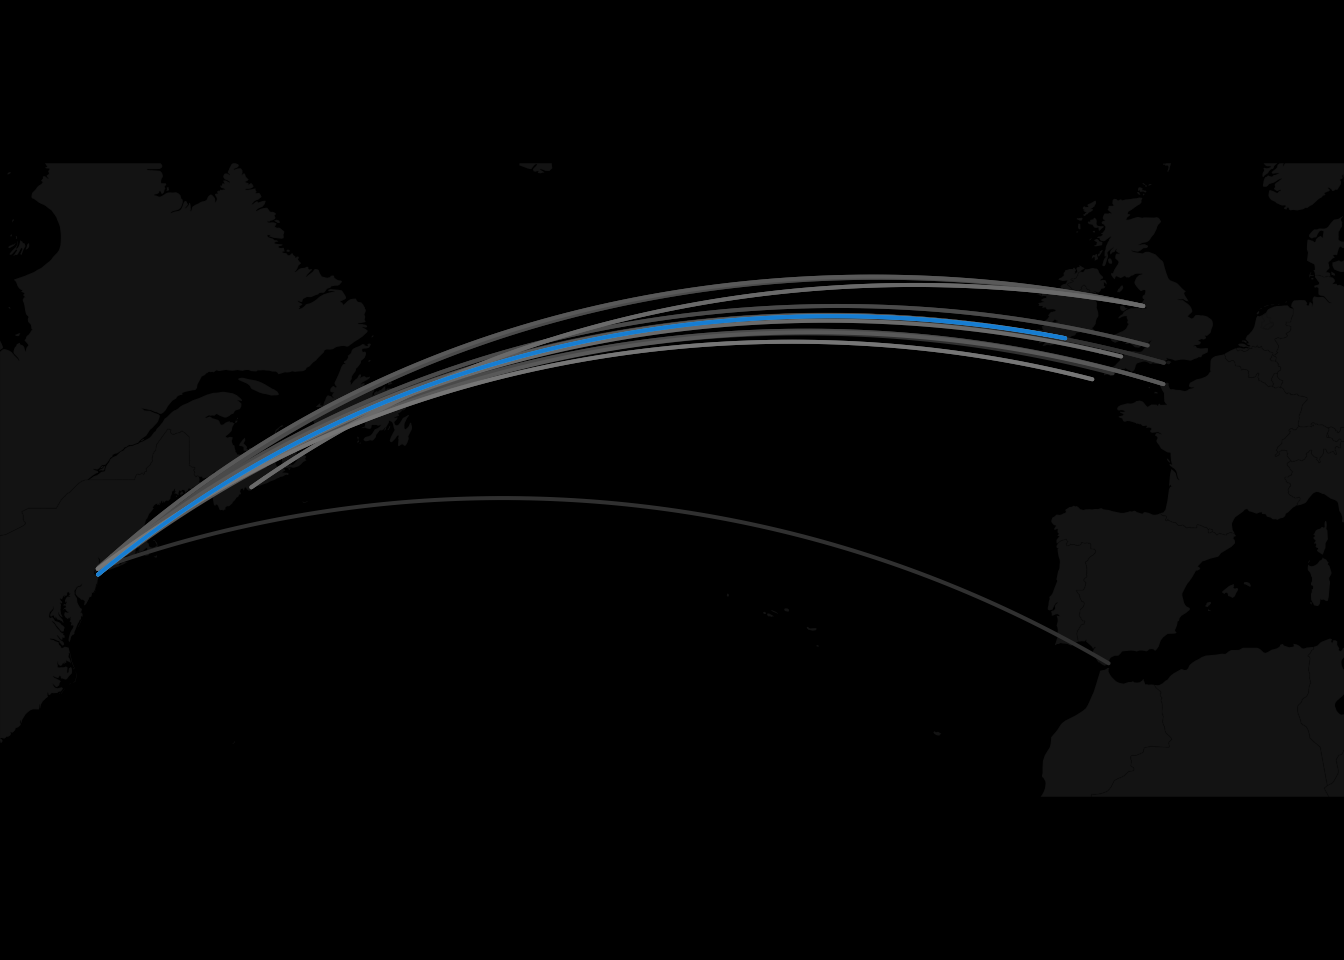
Figure 10.4: Paths over north Atlantic Ocean by blue riband winners. The ‘blue’ path was the one most commonly taken between Queenstown and Sandy Hook.
10.4 NetworkD3 Package
The networkD3 package was created on the D3.js framework by Michael Bostock. It provides an easy way to allow for movement of the nodes.
Figure 10.5: Hello
Resources: