B Top 10 Network Packages in R
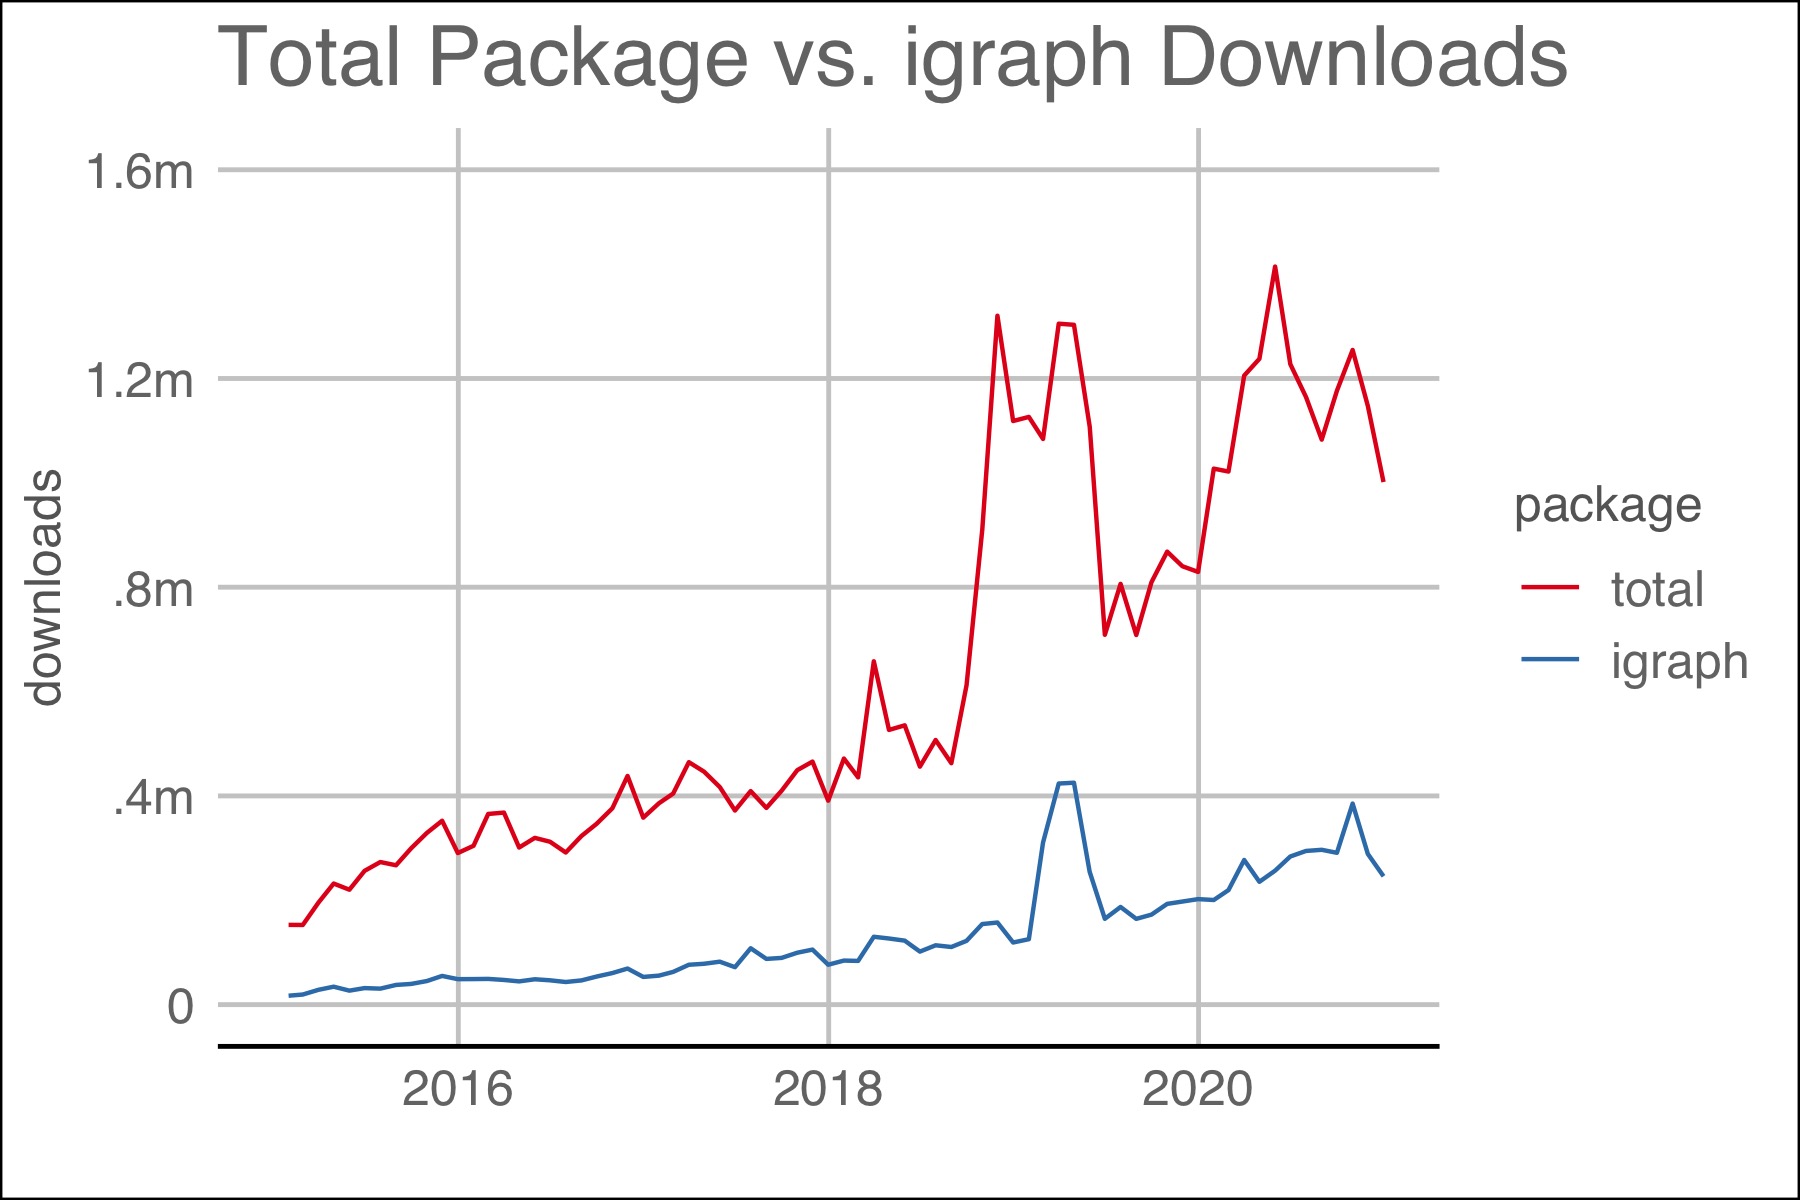
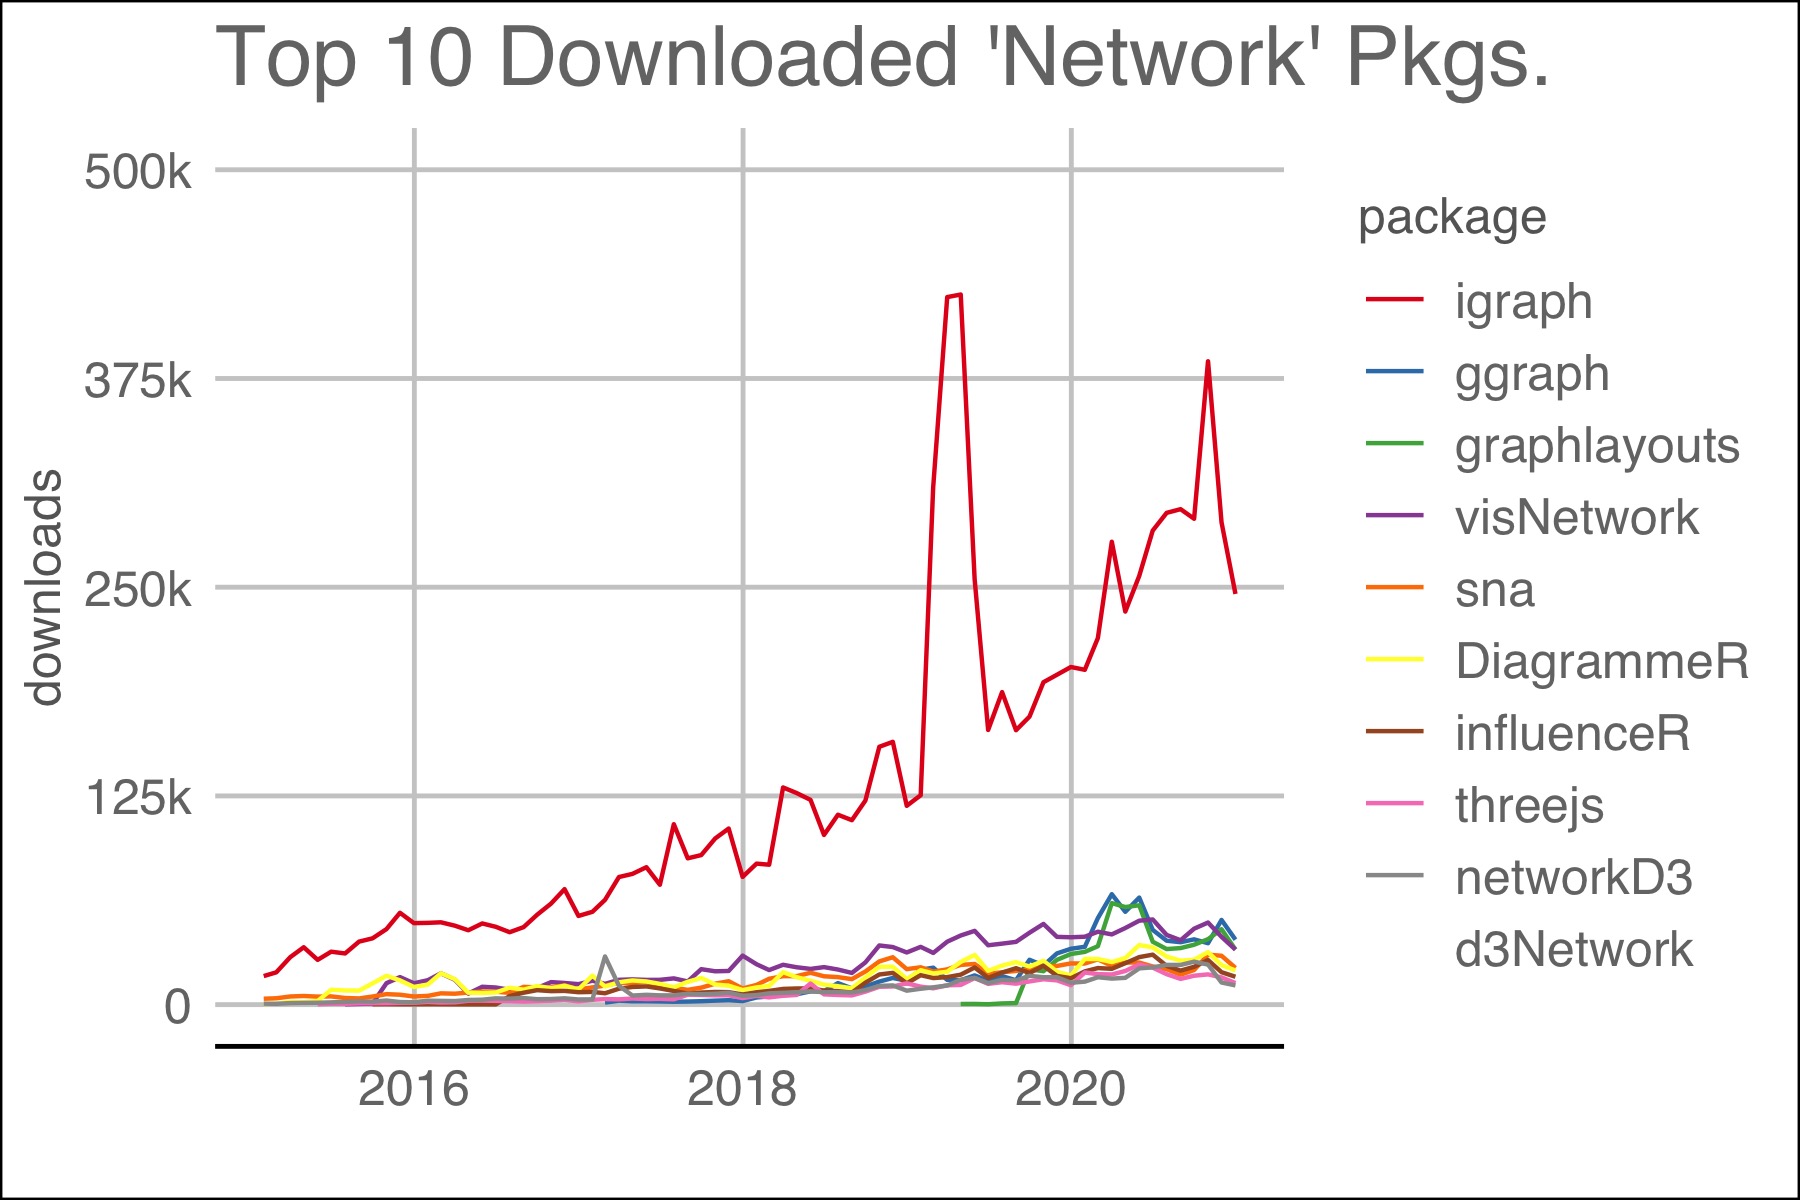
Figure B.1: Figure to left shows igraph downloads to total downloads. Figure to right, with y-axis scale and labels changed, shows igraph downloads relative to other network packages.
| package | downloads | summary |
|---|---|---|
| igraph | 245947 | Routines for simple graphs and network analysis. It can handle large graphs very well and provides functions for generating random and regular graphs, graph visualization, centrality methods and much more. |
| ggraph | 38914 | The grammar of graphics as implemented in ggplot2 is a poor fit for graph and network visualizations due to its reliance on tabular data input. ggraph is an extension of the ggplot2 API tailored to graph visualizations and provides the same flexible approach to building up plots layer by layer. |
| graphlayouts | 32993 | Several new layout algorithms to visualize networks are provided which are not part of ‘igraph’. Most are based on the concept of stress majorization by Gansner et al. (2004) <doi:10.1007/978-3-540-31843-9_25>;. Some more specific algorithms allow to emphasize hidden group structures in networks or focus on specific nodes. |
| visNetwork | 32943 | Provides an R interface to the ‘vis.js’ JavaScript charting library. It allows an interactive visualization of networks. |
| sna | 22029 | A range of tools for social network analysis, including node and graph-level indices, structural distance and covariance methods, structural equivalence detection, network regression, random graph generation, and 2D/3D network visualization. |
| DiagrammeR | 20429 | Build graph/network structures using functions for stepwise addition and deletion of nodes and edges. Work with data available in tables for bulk addition of nodes, edges, and associated metadata. Use graph selections and traversals to apply changes to specific nodes or edges. A wide selection of graph algorithms allow for the analysis of graphs. Visualize the graphs and take advantage of any aesthetic properties assigned to nodes and edges. |
| influenceR | 16695 | Provides functionality to compute various node centrality measures on networks. Included are functions to compute betweenness centrality (by utilizing Madduri and Bader’s SNAP library), implementations of Burt’s constraint and effective network size (ENS) metrics, Borgatti’s algorithm to identify key players, and Valente’s bridging metric. On Unix systems, the betweenness, Key Players, and bridging implementations are parallelized with OpenMP, which may run faster on systems which have OpenMP configured. |
| threejs | 12920 | Create interactive 3D scatter plots, network plots, and globes using the ‘three.js’ visualization library (<https://threejs.org>;). |
| networkD3 | 11508 | Creates ‘D3’ ‘JavaScript’ network, tree, dendrogram, and Sankey graphs from ‘R’. |
| d3Network | 8427 | This packages is intended to make it easy to create D3 JavaScript network, tree, dendrogram, and Sankey graphs from R using data frames. !!! NOTE: Active development has moved to the networkD3 package. !!! |
Borgatti, Stephen P., Martin G. Everett, and Jeffrey C. Johnson. 2018. Analyzing Social Networks. 2nd ed. SAGE Publications Ltd.
Brennecke, Julia, and Olaf Rank. 2017. “The Firm’s Knowledge Network and the Transfer of Advice Among Corporate InventorsA Multilevel Network Study.” Research Policy 46 (4): 768–83. https://doi.org/10.1016/j.respol.2017.02.002.
Csardi, Gabor, and Eric D. Kolaczyk. 2014. Statistical Analysis of Network Data with R. New York: Springer.
Easley, David, and Jon Kleinberg. 2012. “Networks, Crowds, and Markets: Reasoning About a Highly Connected World.” Significance 9: 43–44. https://doi.org/10.1017/CBO9780511761942.
Emch, Michael, Elisabeth D Root, Sophia Giebultowicz, Mohammad Ali, Carolina Perez-Heydrich, and Mohammad Yunus. 2012. “Integration of Spatial and Social Network Analysis in Disease Transmission Studies.” Annals of the Association of American Geographers. Association of American Geographers 105 (5): 1004–15. https://doi.org/10.1080/00045608.2012.671129.
Gabasova, Evelina. 2016. Star Wars Social Network (Version 1.0.1) [Data Set]. Zenodo.
Grandjean, Martin. 2016. “A Social Network Analysis of Twitter: Mapping the Digital Humanities Community.” Edited by Aaron Mauro. Cogent Arts & Humanities 3 (1). Cogent OA: 1171458. https://doi.org/10.1080/23311983.2016.1171458.
Holtz, Yan. 2020. “Network Graph | the D3 Graph Gallery.” https://www.r-graph-gallery.com/network.html.
Jasney, Lorien. 2018. “Introduction to Social Network Analysis in R.” Utrecht University.
Knuth, Donald Ervin. 1993. The Stanford GraphBase: A Platform for Combinatorial Computing. AcM Press New York.
R Core Team. 2020. “An Introduction to R.” https://cran.r-project.org/doc/manuals/r-devel/R-intro.html#Data-frames.