Welcome to Maps with R!
• Work with two-dimensional, geospatial data within R
• Learn about projections and coordinate reference systems
• Learn about map elements and visual aethetics
• Create maps with popular tools like ggplot2, tmap, and leaflet
Plotting
ggplot2
R's most popular plotting package can handle geospatial data with "geom_sf()" and the optional addition of "coord_sf()".
Start
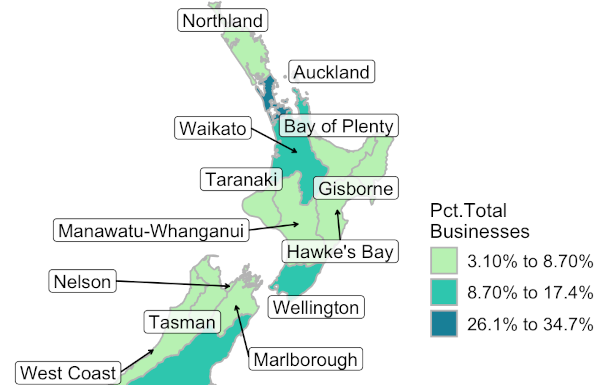
tmap
Flexible and layer-based, tmap can quickly generate thematic maps, such as chorpleths and bubble maps.
Start
leaflet
Create and customize interactive maps using the popular 'Leaflet' JavaScript library. These maps can be used in web applications.
Start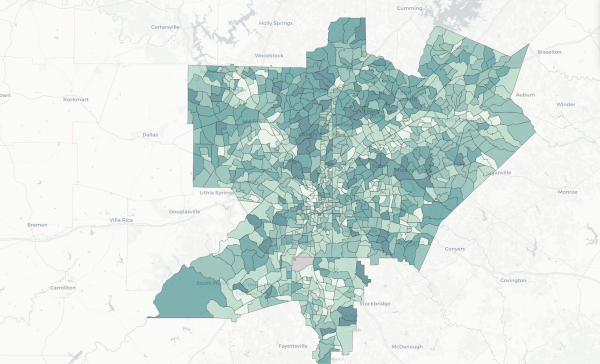
mapview
Render quick plots during the development phase with large datasets to view geometries and their attributes.
Start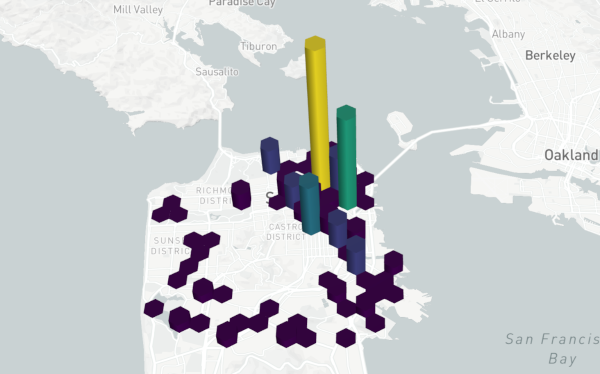
mapdeck
mapdeck is an R library which lets you plot really, really large data sets on interactive maps using Mapbox GL and Deck.gl
Start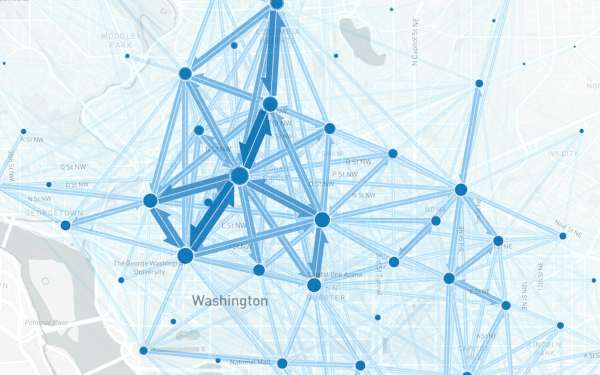
flowmapblue
Create interactive flow maps to visualize commuting patterns, bicycle patterns, migration, paths and many other topics.
Start