Plotting Spatial Data
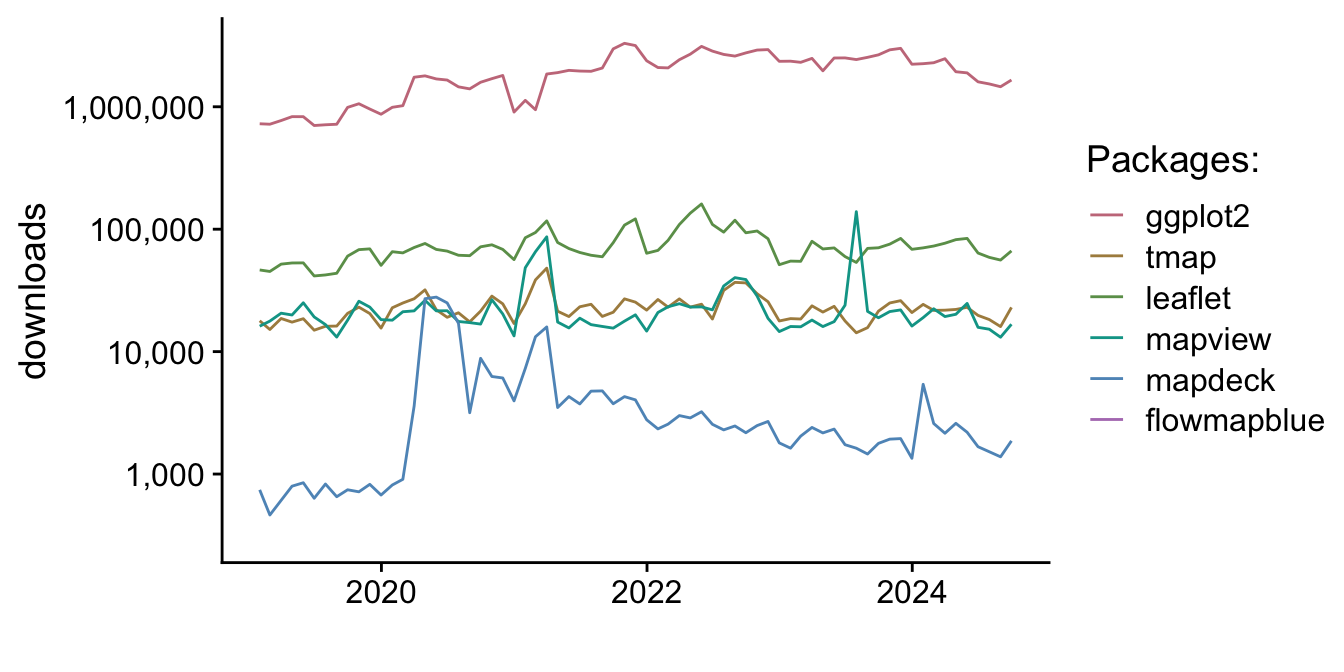
Plotting spatial data is divided into three categories: (1) general concepts, (2) static maps and (3) interactive maps. The first section “general concepts” covers some background about plotting and expands the ideas to maps. For example, maps are expected to contain certain elements like a compass rose, whereas that element would not be expected in a garden-variety scatterplot. The second and third sections deal with R packages for producing maps. To give context and a summary, a plot is included of package downloads and a table summarizing their uses.
1 Package Downloads
2 Summary
| Package | Type | Summary | Pros/Cons |
|---|---|---|---|
| base | static | Base plotting package for R | Small file sizes, included in installation of R, lacks customization |
| ggplot2 | static | Preeminent plotting package; included with tidyverse | Small file sizes, lots of customization, many SO questions, great support, large community, many add-ons |
| tmap | static | Quick thematic plotting of both vector graphics and raster files | Small file sizes, can be customized, syntax similar to ggplot2, small community |
| leaflet | interactive | Java based library for interactive maps | Large file sizes, large community, supported by R-studio, poor for large datasets |
| mapdeck | interactive | Combination of mapbox and deck.gl. | Large file sizes, scales well for large datasets |
| mapview | interactive | Quick creation of interactive maps while in development, not presentation grade | Large file sizes, scales well for large datasets, |
| flowmapblue | interactive | Java based library for flowmaps, map box base tiles | Large file sizes, new package, attractive plots, scales well |